
Most analytics tells you about moments: a visit, a click, a signup. The user journey is the thread that connects those moments into a story, from the first time someone hears about you to the day they become a loyal customer, and sometimes the day they leave. User journey tracking is the practice of following that whole thread rather than staring at isolated snapshots, and it is where the real answers live, because people do not buy in a single visit and they do not stay for a single reason.
This is the complete, end-to-end guide. It covers what a user journey actually is, the stages it moves through, how to track it across sessions and devices, where session tracking and session replay fit, how to read the aggregate journey and the individual one, and how to turn all of it into decisions. It is long because the journey is genuinely long, so treat it as a reference: read it once for the whole model, then return to the section you need. Where a topic has its own deep dive, we link to it.
What user journey tracking actually is
User journey tracking follows one person's path across time, not just their behavior in a single visit. Standard web analytics is excellent at counting what happened in a session: pageviews, sources, bounces. Journey tracking asks the harder question: what is the sequence this person moved through across many sessions, and where did it stall?
The distinction matters because the interesting behavior almost never fits in one visit. Someone discovers you in a community, leaves, comes back from a search two days later, reads your pricing, leaves again, and finally signs up from an email a week on. That is one journey and five sessions, and only tracking that stitches those sessions together tells you the truth about what actually drove the signup. We wrote a practical, small-team version of this in the customer journey tracking guide; this pillar is the full picture behind it.
The stages of a user journey
The most durable model of the journey comes from McKinsey's research on the consumer decision journey, which studied the purchase decisions of roughly 20,000 consumers across five industries and three continents and replaced the old linear funnel with a loop of four connected phases:
| Stage | What the person is doing | What you want to track |
|---|---|---|
| Initial consideration | Becoming aware, forming a shortlist | Which channel introduced them |
| Active evaluation | Researching and comparing | Which pages and content they return to |
| Purchase | Choosing and buying | Where checkout or signup succeeds or breaks |
| Post-purchase | Using, judging, deciding to stay | Whether they activate and come back |
McKinsey's central finding is that the loop, not the funnel, is the right shape, and that brands in a buyer's initial consideration set are more than twice as likely to be purchased as brands added later. The practical implication for tracking is twofold: the first touch matters far more than most teams measure, and the journey does not end at purchase. Post-purchase experience feeds back into whether someone stays and recommends you, so a journey you only track up to checkout is a journey you are reading half of.
Why the end-to-end view matters
Tracking the whole journey, rather than the parts, is where the money is, because value leaks at the seams between stages.
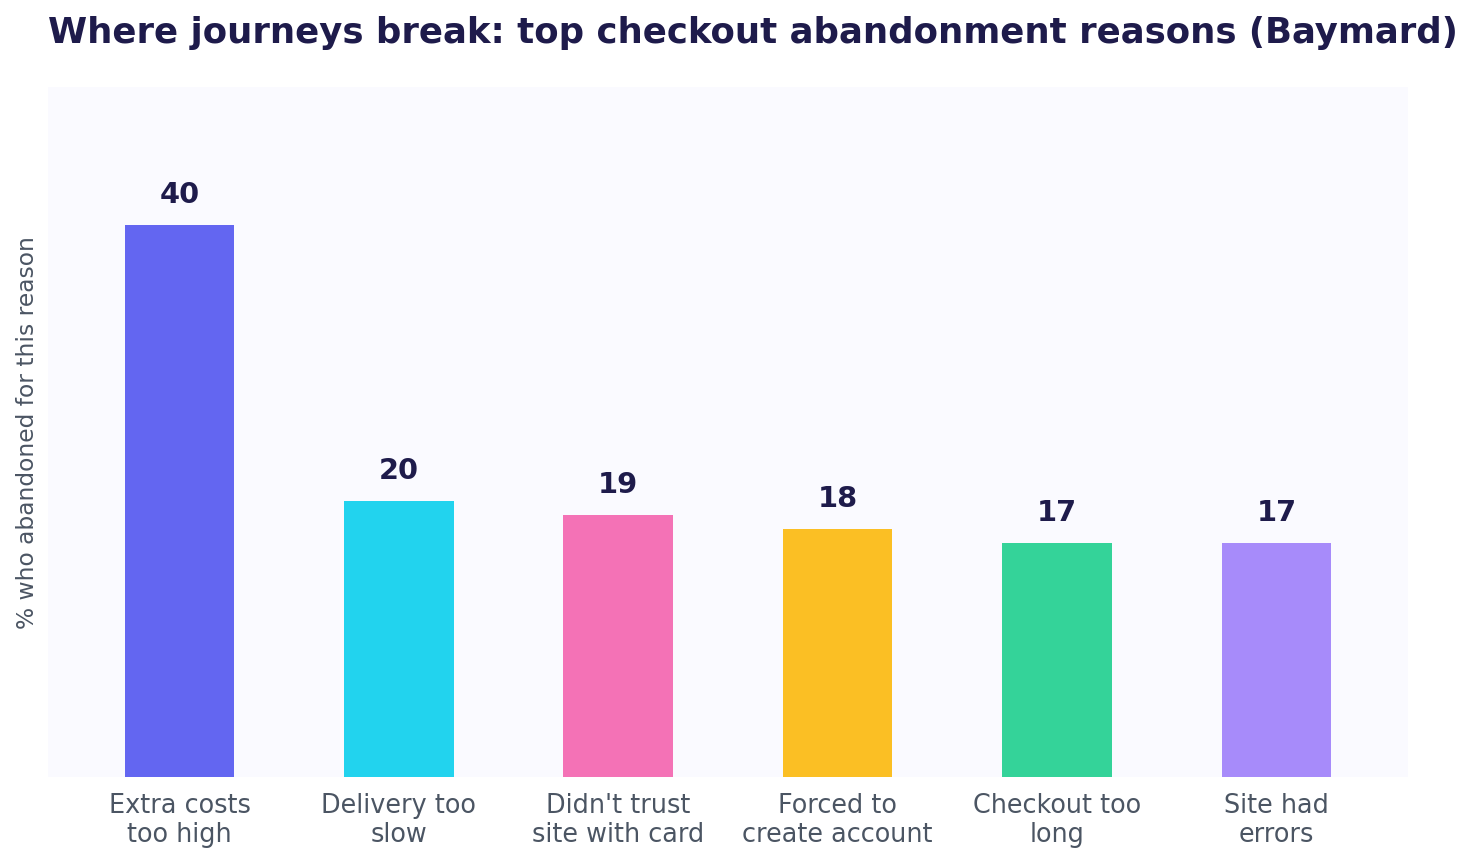
Look at where journeys break mid-purchase. The Baymard Institute puts the average documented cart abandonment rate at 70.22 percent across 50 studies, and its top causes are friction, not disinterest: unexpected costs, a forced account, a checkout that felt long. Those are specific moments in a specific journey, invisible to a headline conversion rate.
Look at the far end, retention, and the case is even stronger. Research by Fred Reichheld at Bain & Company found that increasing customer retention by just 5 percent increases profits by 25 to 95 percent. The post-purchase stretch of the journey, the part most tracking ignores, is disproportionately where profit is made or lost, which is a powerful argument for tracking the journey past the sale, not up to it.
And the journey rarely stays in one place. Salesforce's State of the Connected Customer reports that 67 percent of customers use multiple channels to complete a single transaction, so a journey that looks like one clean session in your analytics is usually several, scattered across channels and devices. Tracking that treats each session as a separate stranger will never show you the real arc.
Activation: the stage that quietly decides everything
Between purchase and retention sits a stage most tracking underweights: activation, the moment a new user first gets real value from what they signed up for. It is where the largest, fastest drop-off in the whole journey usually happens, and it is brutal. Across mobile apps, benchmark data consistently shows the majority of new users abandoning within the first month, with many reports putting day-30 retention in the single digits to low tens of percent depending on category. The exact figure varies wildly by source and industry, so the honest claim is directional rather than precise: most people who acquire a product never reach its value moment, and they leave in the first days, not gradually over months.
For journey tracking, that makes the acquisition-to-activation transition the highest-leverage thing you can watch. It is tempting to obsess over the top of the funnel, more traffic, more signups, but if new users fall out before activation, more signups just means more people churning. Define what activation means for your product, one concrete first-value action, track the percentage of new users who reach it, and treat any leak there as more urgent than a dip in traffic. A journey that acquires well and activates poorly is a bucket with a hole in the bottom, and only tracking the activation stage shows you the hole.
Journey, funnel, and session: three different things
These words get used interchangeably and should not be.
A session is one visit: one browser's activity within a time window. It is the atom of tracking, and most tools count it well.
A funnel is a fixed sequence of steps you define in advance, first visit, signup, activation, and then measure drop-off between them. Funnels are great for a known path you want to optimize.
A journey is the actual, messy route a person took, which often ignores your tidy funnel: they arrive from a channel you forgot to tag, wander sideways, leave, and return a week later. Funnel analytics tells you how many cleared each gate; journey tracking tells you the real path, including the parts you did not anticipate. You want both, but only the journey shows you behavior you did not already expect.
What you actually track across a journey
End-to-end tracking captures a handful of things, each answering a different stage:
- Entry point. Which channel or campaign introduced this person, captured with tagged links, which we cover fully in the complete guide to UTM and link tracking.
- On-site path. The order of pages across visits. The order is the signal, and following it is its own skill, covered in tracking a visitor's path through your site.
- Key actions. The two or three moments that mean progress, usually captured as clicks on specific links and buttons.
- Drop-off point. The last thing someone did before leaving without converting. The highest-value data point you can collect, because it points straight at what to fix.
- Post-purchase behavior. Whether the person who converted came back and stayed. This is the retention stage, and per Bain it is where profit concentrates.
Stitching sessions across time and devices
Here is the genuinely hard part of journey tracking: connecting sessions that belong to the same person. Within one browser, a cookie or identifier ties visits together. Across devices, that breaks. The same human researches on a phone at lunch and buys on a laptop at night, and standard tracking treats those as two unrelated visitors, because the identifier lives on one device.
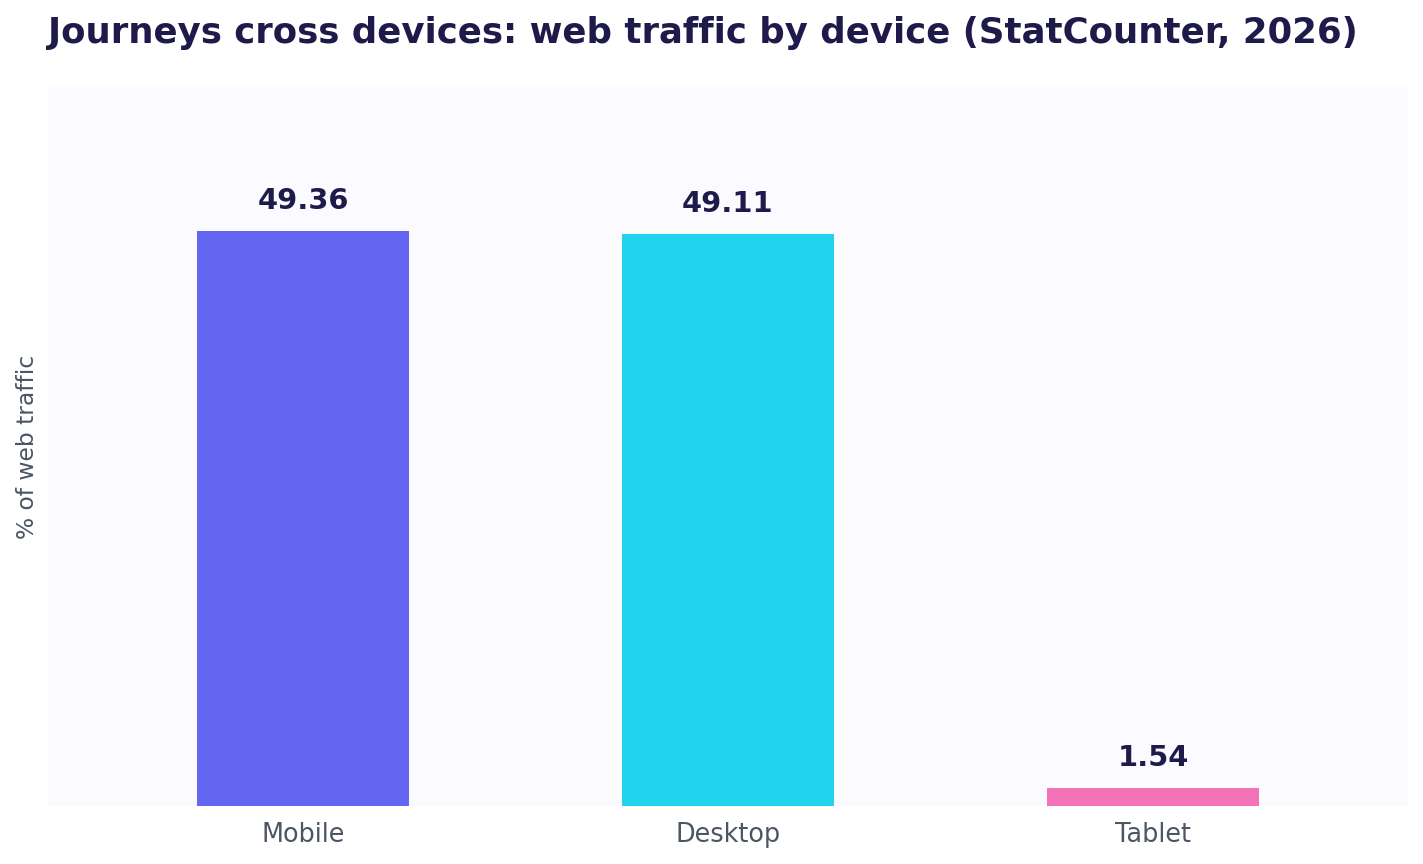
This is not a small edge case. Worldwide, StatCounter puts mobile at 49.36 percent and desktop at 49.11 percent of web traffic, so cross-device journeys are the norm, not the exception. The cross-device gap is the single biggest reason aggregate journey data is an approximation.
There are three honest ways to handle it. First, accept the aggregate blur and read journeys at the population level, knowing they undercount cross-device paths. Second, use a login: once a person signs in, you can stitch their sessions across devices reliably, which is why product analytics tools lean on identified users. Third, for the specific people you care about, issue them a link that identifies them from the first click, so the journey is tied to a known person from the start rather than reassembled from anonymous fragments afterward. Each has a place, and most mature setups use more than one.
Session tracking and session replay
Two related tools deserve their own mention, because they show the journey at a resolution analytics cannot.
Session tracking records the shape of individual visits, how long, how many pages, in what order, which is the raw material journey analysis is built on. Session replay goes further: it records the actual on-page experience, so you can watch a real visit play back, seeing where a person hesitated, mis-clicked, or rage-clicked before giving up. Where a funnel tells you 40 percent dropped at checkout, a replay shows you why: the coupon field that threw an error, the button that looked disabled. Replay is the qualitative complement to quantitative journey data, and several tools offer it free, which we cover in our roundup of the best web visitor tracking tools. The trade is privacy: recording sessions means handling potentially sensitive on-screen data, so reputable replay tools mask inputs by default and you should keep them masked.
Session replay and journey tracking can capture personal data and on-screen input, so they carry real privacy obligations. Mask sensitive fields, disclose what you record, and get consent where the law requires it. This guide explains how the tracking works and is not legal advice; confirm your setup against your own jurisdiction.
Your journey data is noisier than it looks
Before over-trusting any journey report, remember how much of web traffic is not human. According to Imperva's 2024 Bad Bot Report, bots made up 49.6 percent of all internet traffic in 2023, humans just 50.4 percent. Bots do not take real journeys, but they do generate pageviews and events that muddy your aggregate paths. Combine that with the cross-device gap and the general messiness of stitching sessions, and the lesson is familiar: read journey data as a strong signal about patterns, not as a precise ledger. The trend and the shape are trustworthy; the exact counts are not.
The aggregate journey versus the individual journey
This is the fork that decides which tools you need.
Aggregate journey tracking, the domain of product analytics, shows you how populations move through your stages: what percentage of signups activate, how retention curves bend, which paths correlate with conversion. It is essential for spotting systemic problems and is inherently about cohorts, not people. It is also, by design, anonymous in aggregate.
Individual journey tracking shows you one specific person's actual path. For an early-stage team whose growth is one-to-one, this is often the more decision-useful view, because you are not optimizing a cohort yet, you are trying to convert the specific prospect you emailed on Tuesday, and you want to know whether they came back and what they looked at. It rests on issuing that person a unique tracking link so their journey is theirs from the first click. The two are complementary: the aggregate tells you the shape of the crowd's journey, the individual tells you the story of the one journey you care about right now.
Retention, cohorts, and the loyalty loop
The end of the journey is not the sale, it is whether the customer comes back, and tracking that requires thinking in cohorts. A cohort is a group of users who share a starting point, everyone who signed up in March, say, and cohort analysis follows each group's retention over time. It is the single clearest way to see whether your product is getting stickier: if the March cohort retains better at week four than the January cohort did, something you changed is working. Product analytics tools are built around exactly this, and it is a major reason teams adopt them, as we cover in the best PostHog alternatives and best Mixpanel alternatives.
Retention tracking is also where McKinsey's loop and Bain's economics meet. The loyalty loop says a satisfied customer re-enters the journey directly, skipping the long evaluation phase, so retained customers are both cheaper to serve and more likely to buy again. Bain's finding that a 5 percent retention lift can raise profit by a quarter or more is the financial expression of the same idea. For tracking, the lesson is to give retention cohorts at least as much dashboard space as acquisition, because a small, consistent improvement in the retention curve compounds in a way no one-time acquisition spike can. Most teams discover, once they finally chart cohort retention, that their real growth problem was never traffic, it was the leak after activation.
Journey mapping: the practice, not just the tool
Tracking produces data; journey mapping turns it into understanding. A journey map is a simple artifact, the stages a user moves through, what they are trying to do at each, and where they get stuck, laid out end to end. The discipline, long championed by usability researchers like the Nielsen Norman Group, is to map the journey from the user's point of view rather than your funnel's, because the user does not know or care about your internal stages. The value of mapping is that it tells your tracking what to look for: once you have named the stages and the likely friction points, you know which transitions to measure and which drop-offs to watch. Tracking without a map produces dashboards nobody reads; a map without tracking is a guess. Do both, and each sharpens the other.
The tools for end-to-end journey tracking
No single tool covers the whole journey, so journey tracking is a small stack, not one product. The pieces:
- Web analytics for entry points and aggregate traffic, the foundation. Google Analytics 4 is the default; alternatives are compared in the best Google Analytics 4 alternatives and, for the simple privacy-first camp, the best Plausible analytics alternatives.
- Product analytics for funnels, retention, and cohorts, the aggregate journey. The leaders and their trade-offs are in the best Mixpanel alternatives and the best PostHog alternatives, and cost realities in what Mixpanel costs.
- Session replay for the on-page experience, the qualitative layer.
- Per-person tracking for the individual journey, the one-to-one layer.
Most teams do not need all four on day one. They add each as a real question demands it, which is the right order. All of it rests on the fundamentals of counting visits reliably, which is the subject of our complete guide to web visitor tracking if you want the groundwork this pillar builds on.
Journey tracking looks different by business type
The shape of the journey, and therefore what you track, depends on what you sell.
For SaaS and apps, the journey is long and product-centered, and the decisive stages are activation and retention. Signup is cheap; the money is in whether users reach first value and keep coming back, so product analytics and cohort retention matter most, and the acquisition-to-activation transition is the number to guard.
For ecommerce, the journey is shorter and purchase-centered, often several visits over days rather than a long product relationship. The decisive moments are the path to checkout and cart abandonment, where, as Baymard shows, seven in ten carts are lost. Here, on-site path tracking and checkout funnels earn their keep, and session replay is especially valuable for seeing exactly what breaks at payment.
For content and media, the journey is about repeat engagement rather than a single conversion, so the metrics that matter are return visits, depth, and eventually subscription. Entry-point attribution is critical, because content lives or dies on which channels bring readers who come back.
The common thread is that no single template fits, which is why journey mapping comes first: you map your product's real journey, then track the stages that actually decide its outcome, rather than importing someone else's funnel.
First-party data and durable journey tracking
A journey stitched from third-party cookies is a journey built on sand, because those cookies are being dismantled by browsers and regulators. The durable alternative is first-party data, the behavior you collect directly on your own site, with your own relationship to the visitor. For journey tracking specifically, first-party data is what lets you connect sessions honestly over time: a logged-in account, a tagged link you issued, or a per-person link you handed out are all first-party signals that survive the death of the third-party cookie. The practical implication is to build your journey tracking on things you own, your analytics on your site, your tagged links, your identified users, rather than on cross-site tracking that is quietly disappearing. A journey-tracking strategy grounded in first-party data ages well; one leaning on third-party cookies degrades a little more every year.
Setting up journey tracking without overbuilding
A journey-tracking setup is only useful if you read it, so build it bottom-up:
- Tag your entry points. Put UTM parameters on every link you share so the start of each journey is recorded, not guessed.
- Define your two or three key actions, the stage transitions that matter: signup, activation, purchase.
- Watch one core funnel and find the single step where most people leave. That drop-off is your first fix.
- Add replay when you need the why, not before, and keep it privacy-masked.
- Read real individual journeys weekly. For a small team, reading five real journeys end to end teaches more than any average, because the average hides the exact moment a real person hesitated.
That is a practice a team of one can maintain, and it scales cleanly into the fuller stack as you grow.
Leading and lagging signals
Not all journey metrics are equally actionable. Retention and revenue are lagging signals: by the time they move, the cause is already weeks in the past. Activation rate, time-to-first-value, and early return visits are leading signals: they move first and predict the lagging ones, so they are where your daily attention belongs. The craft of journey tracking is watching the leading signals closely enough to act while there is still time, and checking the lagging ones periodically to confirm the leading ones are telling the truth. A team that only watches revenue is forever reacting to last month; a team that watches activation and early retention is actually steering. This is also why the individual journey matters so much early on: with few users, a leading signal is not yet a statistically stable percentage, it is five real people, and reading their actual paths tells you what a cohort average cannot until you have thousands of them.
Common mistakes
Tracking sessions, not journeys. Counting visits in isolation misses the arc. The insight is almost always in the sequence across sessions, not any single one.
Stopping at the sale. The journey loops. If you stop tracking at conversion, you miss activation and retention, which is where, per Bain, the profit concentrates.
Ignoring cross-device reality. Treating a phone visit and a laptop visit as two strangers breaks the journey. Use logins or per-person links when the individual arc matters.
Confusing a funnel with a journey. A funnel measures the path you expected; a journey shows the path people actually took. Only the second surfaces surprises.
Data without a map. Tracking everything and mapping nothing produces dashboards nobody acts on. Map the journey first, then track what the map flags.
The individual journey, tracked end to end
Almost everything above is aggregate, and for systemic decisions that is correct. But there is a question aggregate journey tracking structurally cannot answer: what was the complete path of this one specific person, the prospect, the investor, the community member you personally care about?
This is what ScoutVibe was built for. Instead of reconstructing anonymous fragments, it issues a specific person their own link, so their journey is tied to them from the first click, and it shows the exact path that individual took through your site, which pages, in what order, and where they stopped. Its distinctive move is that you can record an ideal path once, the route you wish everyone took, and then watch how each real journey diverges from it, which turns "did they convert" into "exactly where did this person leave the path I designed." It does not replace product analytics or web analytics; it answers the individual, end-to-end question they were never built for, and it sidesteps the cross-device and dark-traffic problems because the identity is set at the link, not guessed afterward.
What to measure at each stage
A journey is easier to track when you know the one number that matters at each stage. You do not need dozens of metrics; you need one honest signal per phase and the discipline to watch it.
| Stage | The one metric to watch | The question it answers |
|---|---|---|
| Initial consideration | Traffic by source | Which channels introduce people |
| Active evaluation | Return visits and pages per journey | Are people seriously evaluating |
| Purchase | Conversion rate at the key step | Where does the sale break |
| Activation | Percent of new users reaching first value | Do signups become real users |
| Post-purchase | Retention over time | Do customers stay and return |
The power of one-metric-per-stage is that it forces you to look at the whole loop, not just the stage you enjoy optimizing. Most teams over-measure acquisition and under-measure activation and retention, which is exactly backwards given where value concentrates. If you track nothing else, track the transition into and out of each stage, because the transitions, not the stages, are where journeys break.
A worked example: one journey, end to end
To make this concrete, follow a single realistic journey. A founder posts a tagged link in a niche community. A reader clicks it on their phone, reads a blog post, and leaves, that is initial consideration, and because the link was tagged, the source is recorded rather than lost to "direct." Two days later the same person searches the product name and lands on the homepage on a laptop, active evaluation, but standard analytics sees a new anonymous visitor, because the device changed. They read pricing, start a signup, and abandon at the payment step, a purchase-stage drop-off a funnel would flag but not explain. A session replay would show why: a confusing plan selector. A week later an email brings them back and they complete signup, but they never use the core feature, an activation failure that retention tracking will surface as churn a month on.
Notice how many tools that one journey touched: tagged links for the entry, analytics for the pages, a funnel for the drop-off, replay for the reason, and retention tracking for the ending. Notice too how the cross-device switch fragmented it into pieces that only a login or a per-person link could have stitched back together. That single story is why journey tracking is a stack, not a tool, and why the individual, per-person view is often the only one that shows the whole arc without gaps.
From journeys to decisions
Journey data earns its keep only when it changes what you do. The habit is a short, regular review with a single question: where in the journey are people leaving, and what is the one change that would help. Then make that change and watch the same transition next week. A stage where most people drop is your highest-value fix, not your traffic total. A channel that brings visitors who never reach stage two is one to question, not to scale. And the post-purchase stretch, the one most teams never look at, is where a 5 percent retention improvement can move profit by a quarter or more, so it deserves at least as much attention as acquisition. The point of mapping and tracking the journey is to shorten the distance between noticing a leak and fixing it, one stage at a time.
Putting it together
User journey tracking, done end to end, is the discipline of following one thread through many moments: tagging the entry so you know where a journey began, watching the on-site path and key actions so you see how it progressed, catching the drop-off so you know where it broke, and tracking retention so you know whether it lasted. It is a stack, not a tool, because no single product spans awareness to loyalty, and it is a practice, not a purchase, because the map and the weekly review matter more than any dashboard. Ground it in first-party data so it survives the fading cookie, respect the visitor's privacy at every stage, and remember that the aggregate shows you the crowd's shape while the individual shows you the one story that decides your next move. It also depends on the two disciplines underneath it: reliably counting visits, and attributing where they came from, which we cover in the complete guide to UTM and link tracking. Start with the entry point and one funnel, add stages as your questions grow, and let the journey, not the dashboard, be the thing you actually manage.
A short glossary of journey-tracking terms
| Term | What it means |
|---|---|
| User journey | One person's full path across time and sessions |
| Session | A single visit within a time window |
| Funnel | A predefined sequence of steps you measure drop-off between |
| Cohort | A group of users sharing a trait or start date |
| Retention | Whether users come back over time |
| Activation | The moment a new user first gets real value |
| Session replay | A recording of a real visit's on-page experience |
| Cross-device gap | The break when one person uses several devices |
| Journey map | A user-centered layout of stages and friction |
| Ideal path | The route you wish users took, to compare reality against |
Frequently asked questions
What is user journey tracking?
User journey tracking is following one person's path across time and multiple sessions, from first awareness through purchase and beyond, rather than analyzing isolated visits. It answers what sequence someone moved through and where they stalled, which single-session analytics cannot, and it usually combines web analytics, product analytics, session replay, and per-person tracking.
What is the difference between a user journey and a funnel?
A funnel is a fixed set of steps you define in advance and measure drop-off between. A journey is the actual, often messy route a person took, which frequently ignores your funnel: arriving from an untagged channel, wandering sideways, and returning later. Funnels measure the path you expected; journeys reveal the path people actually took, including the surprises.
What is session replay and how does it relate to journey tracking?
Session replay records the on-page experience of a real visit so you can watch where a user hesitated, mis-clicked, or gave up. It is the qualitative complement to quantitative journey data: where a funnel says 40 percent dropped at a step, replay shows why. Use it with input masking on, since it can capture sensitive on-screen data.
How do you track a user journey across devices?
Within one browser, a cookie or identifier stitches sessions together, but across devices that breaks, and roughly half of web traffic is mobile, so cross-device journeys are common. The reliable ways to connect them are a login, which ties sessions to an account, or a per-person link that identifies the individual from the first click rather than reassembling anonymous fragments afterward.
Why track the journey after purchase?
Because that is where profit concentrates. Bain research found that increasing retention by just 5 percent can raise profits by 25 to 95 percent, and the customer journey is a loop, not a funnel, so post-purchase experience feeds back into whether someone stays and recommends you. Tracking only up to the sale misses the most valuable stage.
Is user journey tracking the same as product analytics?
Product analytics is a major part of it, the aggregate part, showing how populations move through funnels, retention, and cohorts. Journey tracking is broader, also covering entry-point attribution, session replay, and the individual journey of one specific person. Product analytics answers how the crowd moves; the full journey picture also answers how one person moved.
Can I track one specific person's whole journey?
Aggregate tools identify users only as anonymous ids in a cohort. To follow one specific person end to end, issue them a unique link so their identity is set from the first click, which is what per-person tools like ScoutVibe do. This also avoids the cross-device and dark-traffic gaps, because the journey is tied to a known person rather than guessed from fragments.
How do I start tracking user journeys without a big budget?
Start bottom-up and free: tag entry points with UTMs, define two or three key actions, watch one core funnel for its biggest drop-off, and read a few real journeys each week. Add session replay and product analytics, both of which have free tiers, only when a specific question demands them. The method matters more than the spend.
Aggregate tools show the crowd's journey as anonymous cohorts. ScoutVibe shows one specific person's journey end to end, from a link you gave them, and how it diverges from the path you designed. The free tier covers your next launch.
Try ScoutVibe